
Filter by
SubjectRequired
LanguageRequired
The language used throughout the course, in both instruction and assessments.
Learning ProductRequired
LevelRequired
DurationRequired
SkillsRequired
SubtitlesRequired
EducatorRequired
Results for "scatter plots"
 Status: Free Trial
American Psychological Association
Skills you'll gain: Statistical Hypothesis Testing, Quantitative Research, Probability & Statistics, Statistical Methods, Statistical Analysis, Statistical Inference, Statistics, Data Analysis, Descriptive Statistics, Sampling (Statistics), Regression Analysis, Data Literacy, Research Design, Research, Psychology
 Status: Free Trial
University of Colorado Boulder
Skills you'll gain: Descriptive Statistics, Excel Formulas, Data Transformation, Probability Distribution, Data Cleansing, Data Visualization, Probability, Statistics, Data Analysis, Exploratory Data Analysis, Histogram, Microsoft Excel, Box Plots, Statistical Analysis, Scatter Plots
 Status: NewStatus: Free Trial
University of Colorado Boulder
Skills you'll gain: Dashboard, Tableau Software, Data Visualization, Interactive Data Visualization, Data Visualization Software, Data Storytelling, Geospatial Mapping, Data Presentation, Spatial Analysis, Graphing, Histogram, Color Theory, Scatter Plots, Data Integration, Data Analysis, Data Import/Export, Business Analytics, Marketing Analytics, Analytics, Forecasting
Coursera Project Network
Skills you'll gain: Data Visualization, Data Presentation, Plot (Graphics), Interactive Data Visualization, Data Visualization Software, Graphing, Javascript, Data Analysis, Microsoft Visual Studio
Coursera Project Network
Skills you'll gain: Descriptive Statistics, Sampling (Statistics), Statistical Visualization, Pareto Chart, Statistical Analysis, Statistics, Histogram, Statistical Software, Box Plots, R Programming, Probability Distribution, Data Science, Test Data, Data Import/Export
Coursera Project Network
Skills you'll gain: Predictive Analytics, Data-Driven Decision-Making, Ggplot2, Regression Analysis, Data Visualization, Data Analysis, R Programming, Statistical Modeling, Exploratory Data Analysis, Descriptive Statistics, Statistical Analysis
 Status: Free Trial
American Psychological Association
Skills you'll gain: Descriptive Statistics, Probability & Statistics, Statistical Methods, Statistical Analysis, Statistical Visualization, Graphing, Data Analysis, Psychology, Arithmetic
Coursera Project Network
Skills you'll gain: Statistical Hypothesis Testing, Six Sigma Methodology, Scatter Plots, Statistical Methods, Correlation Analysis, Exploratory Data Analysis, Regression Analysis, Statistical Process Controls, Data Literacy, Statistical Analysis, Statistical Programming, Probability & Statistics, Statistical Software, R Programming, Data Science, Statistical Modeling
 Status: Free Trial
Duke University
Skills you'll gain: Generative AI, Large Language Modeling, Artificial Intelligence, Artificial Intelligence and Machine Learning (AI/ML), Machine Learning, Exploratory Data Analysis, Artificial Neural Networks, Scientific Visualization, Predictive Modeling, Visualization (Computer Graphics), Interactive Data Visualization, Image Analysis, Deep Learning, Python Programming, Natural Language Processing, Plot (Graphics)
 Status: Preview
Rice University
Skills you'll gain: Microsoft Excel, Spreadsheet Software, Pivot Tables And Charts, Data Visualization Software, Data Literacy, Excel Formulas, Histogram, Graphing, Data Analysis, Scatter Plots, Productivity Software, Data Manipulation
 Status: Free Trial
American Psychological Association
Skills you'll gain: Statistical Hypothesis Testing, Quantitative Research, Statistical Analysis, Probability & Statistics, Statistical Software, Data Analysis, Descriptive Statistics, Statistical Inference, Regression Analysis, Psychology, Research
 Status: Free Trial
Vanderbilt University
Skills you'll gain: Data Analysis, Statistical Analysis, Regression Analysis, Statistics, Generative AI, Probability & Statistics, Data-Driven Decision-Making, Predictive Analytics, Artificial Intelligence, Scatter Plots
In summary, here are 10 of our most popular scatter plots courses
- t-Tests of Hypotheses About Means: American Psychological Association
- Statistics and Data Analysis with Excel, Part 1: University of Colorado Boulder
- Data Visualization & Analytics in Tableau: University of Colorado Boulder
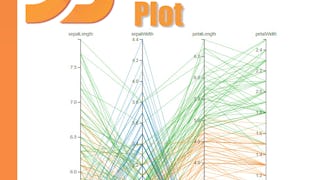
- Simple Parallel Coordinates Plot using d3 js: Coursera Project Network
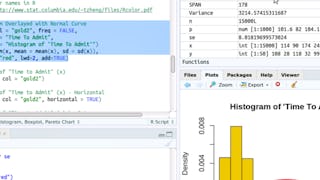
- RStudio for Six Sigma - Basic Descriptive Statistics: Coursera Project Network
- Data Analysis in R: Predictive Analysis with Regression: Coursera Project Network
- Measures of Central Tendency: American Psychological Association
- RStudio for Six Sigma - Hypothesis Testing: Coursera Project Network
- Explainable Machine Learning (XAI): Duke University
- Introduction à l'analyse de données à l'aide d'Excel: Rice University


